Building an End-to-End IoT Data Analytics
The rise of the Internet of Things (IoT) has drastically transformed the way we interact with and leverage data from physical devices. As industries embrace IoT for various applications, from smart factories to real-time health monitoring, a significant challenge arises: how to efficiently gather, store, analyze, and visualize this massive influx of data in real-time. This blog delves into a real-world implementation of an IoT project utilizing several cutting-edge technologies to build a full data pipeline that ingests data from industrial devices, processes it at the edge, stores it efficiently, and visualizes analytics.
Overview of the System Architecture
In this project, we have an interconnected architecture where data flows from industrial devices via OPC-UA into a real-time system. Below is a step-by-step breakdown of the components used and their roles:
- Node-RED for OPC-UA Integration: #Node-Red
- MQTT Broker for Data Transport (EMQX): EMQ Technologies
- Python for MQTT Client and Data Processing: #Python
- QuestDB for Time-Series Storage: QuestDB
- Grafana for Real-Time Visualization: #Grafana
- Edge Analytics for On-Site Intelligence: #Edge
- DuckDB for Aggregated Storage: #DuckDB
- PowerBI for Business Intelligence: #PowerBI
Detailed Explanation of Components
1. Node-RED and OPC-UA Integration
Node-RED is an open-source flow-based development tool that simplifies the process of integrating IoT devices. It provides a graphical interface where users can design flows that connect various nodes representing devices, APIs, and services.
In this case, OPC-UA is a widely used communication protocol in industrial automation for data exchange. Node-RED’s OPC-UA node allows it to interface with industrial machines and sensors, extracting valuable operational data.
This data is then sent to an MQTT broker (EMQX) as the next step.
2. MQTT with EMQX Broker
MQTT is a widely adopted protocol in IoT projects because of its efficiency in environments with constrained bandwidth and high latency. The protocol works on a publish-subscribe model, where devices (publishers) send data to specific topics, and consumers (subscribers) can subscribe to these topics to receive the data.
In this architecture, EMQX is the MQTT broker that handles communication between Node-RED (acting as a publisher) and a Python program (acting as a subscriber). This broker ensures secure, scalable, and fast data transmission from IoT devices to processing systems.
3. Python for Data Processing
The Python client subscribes to the MQTT topics and reads the data being streamed from the industrial devices. The main tasks of this Python program are:
- Parsing the incoming messages.
- Performing initial data processing, which can include data cleaning, normalization, or transformation.
- Forwarding the data to QuestDB for storage or performing immediate edge analytics.
4. QuestDB for Time-Series Data
Time-series databases like QuestDB are optimized for storing data where time is a critical component, as is the case with IoT sensor data. QuestDB can handle massive amounts of high-frequency data, allowing for efficient storage and fast querying.
This is essential for our real-time dashboards, which need immediate access to the latest data points to ensure accuracy in monitoring the state of devices.
5. Grafana for Visualization
Grafana connects to QuestDB to create intuitive and real-time visual dashboards. This allows for real-time monitoring of device health, performance metrics, and sensor readings. Grafana’s flexibility with queries, along with its wide array of visualization options, makes it ideal for real-time IoT analytics.
6. Edge Analytics
Edge analytics refers to performing analytics at or near the data source (the edge) rather than sending all data to a central cloud or server for analysis. This approach has several advantages:
- Reduced Latency: Since data is analyzed locally, insights can be generated instantly, allowing for real-time decision-making.
- Bandwidth Optimization: Instead of sending all raw data to the cloud, only valuable, pre-processed, or filtered data is transmitted, significantly reducing network congestion.
- Enhanced Security: Sensitive data can be analyzed locally, ensuring that only necessary data is transmitted, reducing the risk of exposure.
In our project, edge analytics plays a crucial role. The Python program performs real-time analysis on data as soon as it arrives from the MQTT broker. Examples of edge analytics include anomaly detection (detecting out-of-range values), simple event-based rules (if temperature exceeds a threshold, trigger an alert), or summarization of data (e.g., calculating average values over a window of time).
7. DuckDB for Aggregated Analytics Storage
DuckDB is a high-performance analytical SQL database designed to be embedded in analytics environments. Once edge analytics is completed, the summarized data (such as daily averages, trends, or key insights) is stored in DuckDB for further analysis.
DuckDB is lightweight and designed for complex analytics queries, making it ideal for handling aggregated IoT data on the edge before it is sent to more comprehensive reporting tools like PowerBI.
8. PowerBI for Business Intelligence
Finally, PowerBI is used for visualizing the aggregated data stored in DuckDB. While Grafana focuses on real-time, operational monitoring, PowerBI is used for business-level insights such as:
- Aggregated trends over time.
- Detailed usage reports.
- Performance comparisons across devices or periods.
By connecting PowerBI to DuckDB, we create rich, interactive dashboards and reports that provide deeper insights to decision-makers.
IoT Analytics and Edge Analytics
IoT Analytics refers to the analysis of data produced by IoT devices. It typically involves:
- Real-time Analytics: Monitoring live streams of data to identify trends, patterns, or issues in real time.
- Historical Analytics: Storing IoT data for long-term analysis, allowing organizations to track performance over time and make data-driven decisions.
Edge Analytics is a subset of IoT analytics performed directly on devices or near the data source. It is critical in situations where latency is a concern, bandwidth is limited, or immediate action is required. This approach is especially important in industrial IoT, where even small delays in detecting faults or anomalies can lead to significant consequences, including operational downtime or equipment failure.
Conclusion
In this project, we built an efficient, real-time IoT pipeline that integrates a range of technologies, from Node-RED for device data extraction, EMQX as the MQTT broker, Python for processing, QuestDB for real-time data storage, Grafana for visualization, DuckDB for analytics storage, and finally PowerBI for business intelligence reporting.
The use of edge analytics ensures that data processing happens close to the source, reducing latency and improving the system’s responsiveness, while IoT analytics provides deeper insights and better decision-making capabilities by analyzing both real-time and historical data. By leveraging this architecture, industries can streamline their IoT workflows and gain powerful insights from their devices, driving efficiency and innovation.
Cloud Analytics
This can further be extended to send IoT data in the cloud (shaded area in the above solution diagram) and perform various data analytics and machine learning activities.
Should you have queries and you want to discuss further on this solution architecture please feel free to reach out to me at rakesh@sketchmyview.com


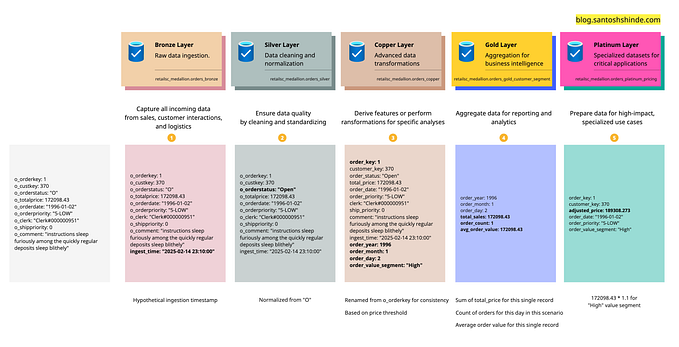
![Azure End-to-End Data Engineering Project: Medallion Architecture with Databricks [Part 2]](https://miro.medium.com/v2/resize:fit:679/0*m8-NjvFFlKGa1tku.jpeg)